What is Metabase?
Metabase is an open-source business intelligence (BI) tool for data analysis that empowers organizations to easily analyze, visualize, and share data with one another. It is designed to be user-friendly, allowing users with absolutely no technical background to search for and extract valuable insights from their databases. As an open-source solution, Metabase offers a cost-effective and affordable option for companies building their data infrastructure, and it can even complement existing analytics tools by running alongside other dashboard software.
Open Source Software (OSS) refers to software whose source code is freely available for use without any fees paid to any party. Because the source code is distributed freely, you, as a user, are free to use and modify the code you obtain. However, terms and conditions still apply depending on the license issued by the owner, which is usually clearly stated, such as on this Metabase website page. A license here does not mean you need to purchase per-user licenses like you would with proprietary software.
Key Features of Metabase
Metabase has reached version 0.56 as of the publishing date of this article. It is regularly updated to introduce many features requested by the community to improve user experience. Among the many new features being introduced, upcoming releases will feature Metabot, an AI bot integrated directly into Metabase.

Ask a Question
With the built-in query builder in Metabase, creating queries is incredibly easy, just like asking Metabase a question. You can build queries simply by clicking, checking boxes, and using drag-and-drop features, making it highly accessible for anyone, including those with no SQL knowledge. You can choose from various pre-configured data sources, which are divided into three categories:
- Database Tables: You can select tables directly from your database simply by pointing and clicking. You can connect to many types of databases, such as PostgreSQL, Oracle Database, BigQuery, and more.
- Models: These are virtual tables stored within Metabase. Virtual tables can be defined from the results of joining multiple tables, similar to creating a view within a database.
- Saved Questions: These are queries that have been previously created via “New Question” and saved. In other words, you can use a previously created query as the data source for a new one. This is very powerful because even users who do not understand SQL can create subqueries from other queries using this feature.

Visualize in Charts
Questions that have been created can be displayed in various chart formats. While you might think a table view is more than enough, charts are incredibly helpful for identifying patterns and finding answers to your questions. Charts can also be customized to your liking.

Drill Down
The charts you create are interactive, allowing you to dive deeper into the displayed data. If your chart shows total sales value per product category, simply click on one of the categories, and Metabase will display the breakdown of all sales within that specific category. This works instantly without requiring any complex coding or scripting.

Create Your Own Metabase Dashboard
Just like Questions, you can also create your own Dashboards without any coding. Dashboards are designed to display multiple related Questions simultaneously on a single page. For example, if you create a Dashboard to monitor sales performance, it will contain Questions featuring sales metrics such as sales value by order date, total orders, number of customers, and so on.

Share and Collaborate
Once you have created a Question or Dashboard, simply place it in the appropriate folder so other users can access it. This ensures everyone in the company can analyze data using the exact same single source of truth. Dashboards can also be set up to be sent out periodically, such as daily reports. This is highly useful when reports need to be sent on a specific schedule, like sending stock reports to customers.

Access Setup
Along with all its advantages in retrieving and sharing data, Metabase comes with comprehensive features to manage data access. Access can be granted to individual users based on predefined groups. The shared access controls cover data sources, data tables, as well as the folders storing Questions and Dashboards.
With its vast array of complete features, Metabase is one of the most comprehensive dashboard software options available on the market today. Because it is open-source, it significantly eases the user’s journey in processing and utilizing data further, from reporting and analytics to forecasting.
Why Use Metabase Dashboards?
When implementing a BI solution, there are several key points to consider when comparing different BI software. These points include:
- Ease of Getting Started
- Total Cost of Ownership (TCO)
- Self-Service Analytics
- Scalability
Key Considerations when Choosing BI Software
Ease of Getting Started
The easier an application is to use, the more people will adopt it. It often happens that BI applications are too difficult to use; when users want to get new data, they cannot do it themselves and have to wait weeks for a data analyst to prepare it. Metabase can be deployed in a very short time and is exceptionally easy to use without requiring SQL skills. Since there is no requirement to purchase licenses, you are free to start using Metabase in just one department or even with just one person. Afterward, you can gradually roll Metabase out to other people or departments without any additional costs or extra installations.
Total Cost of Ownership (TCO)
Generally speaking, the costs arising from owning a BI solution are divided into:
- Software License Fees
- Infrastructure Costs
- Initial Setup Costs
- Development Costs
- Support & Maintenance Costs
Because Metabase is open-source software, you do not have to pay software license fees to a vendor, which also means you are free to use Metabase for as many users as you want without being limited by license caps. With no licensing fees, you can better maximize your IT budget for other things, such as building a more optimal Data Warehouse. Speaking of Data Warehouses, you are also not locked into using specific technologies. This keeps your infrastructure costs lower since you have a wider variety of options.
For example, if you use Microsoft Power BI, you will need supporting applications from Microsoft itself, such as a Data Warehouse from Azure Synapse, and then use SQL Server Analysis Services for data transformation. All of this triggers vendor lock-in. If you use Metabase, you are free to host it on any cloud server, use any data transformation tools (like Apache HOP), and connect to any data warehouse (Postgres, SQL Server, etc.).
Its ease of setup means the time required deployment is very short, making setup costs much cheaper compared to other BI deployments. Its user-friendliness, which requires no technical skills, allows users to add dashboards on their own without needing vendor assistance, thereby minimizing development costs.
Self Service Analytics
A common scenario in companies occurs when a user wants data: they communicate their request to a Data Analyst to write a query for the desired data. This communication and retrieval process usually takes 1–2 weeks, depending on the data required and how many other users are also requesting data.
Users can be empowered to pull data independently, especially data they look at regularly, without needing assistance, by providing a self-service BI tool. Here, Metabase’s ease of use and its automated email reporting features will help drive the company toward a culture of self-service analytics.
Metabase Cloud
If you want to get direct support from the Metabase team and prefer hosting on cloud servers provided by Metabase, there is an option to use Metabase as a service. In addition to getting support and servers from Metabase, there are several premium features available, such as removing or changing the Metabase branding and colors, and setting deeper permission levels. However, the core BI features you get will remain the same regardless of the version chosen. Metabase is divided into three tiers:
- Starter
This version includes the same features as the Metabase Community Edition. What you get from this tier is simply Metabase Cloud hosting and support from the Metabase team.
- Pro
The Pro version includes premium features to customize Metabase colors and logos, along with more advanced permission levels. You also get Metabase Cloud hosting and support from the Metabase team.
- Enterprise
This version comes with faster support response times and dedicated treatments, such as hosting on a single, isolated server.
Equipped with powerful analytics features, an interface that anyone can easily use, and no licensing fees, Metabase is a Business Intelligence tool that companies of all sizes must consider. The diverse hosting options, ranging from on-premise to Metabase Cloud, also provide flexibility for companies to choose a solution that fits their needs. Despite being open-source, Metabase offers variety that allows it to compete head-to-head with other mainstream Business Intelligence tools.
How to Create a Dashboard in Metabase
If you have finished installing Metabase on your server or PC, getting started is very simple. Log directly into Metabase through your browser and complete a few basic setups. After that, connect to your database if you have one, or you can also use Metabase immediately without connecting to a database first. Once the setup is complete, you can try creating your very first Question.
Do you have an ERP system? Use this Metabase with ERP guide to help you implement this program in your company.
Creating a Question
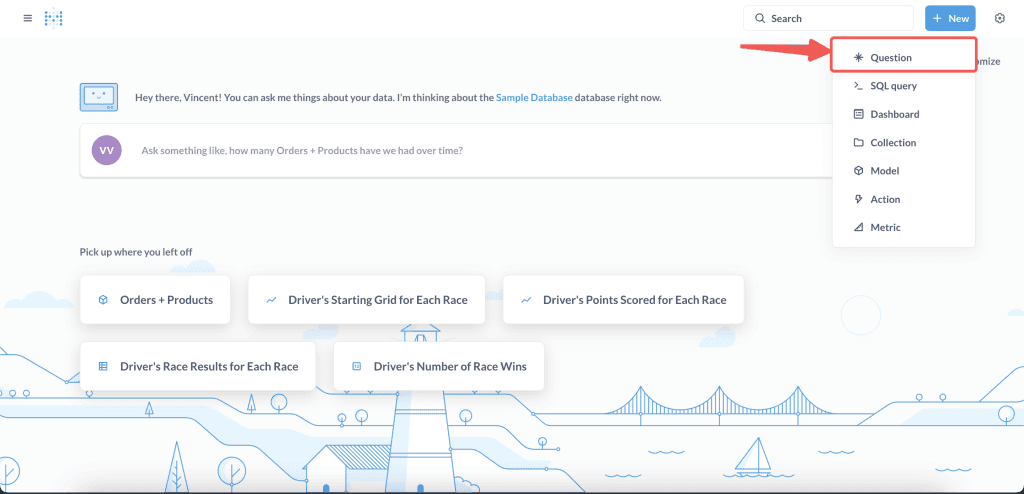
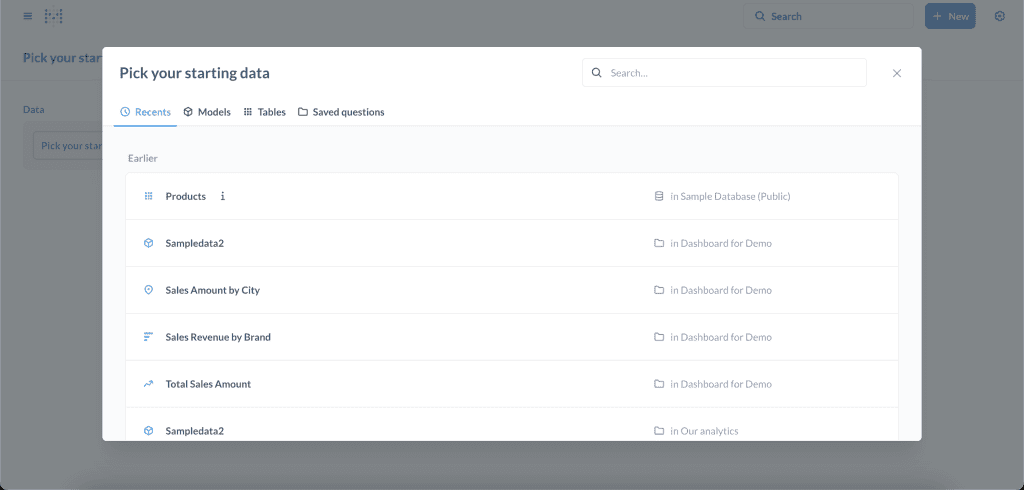
Questions can be created very easily through the built-in Query Builder in Metabase. The process is straightforward: just click New > Question, and you will be prompted to select the data source you want to use.

Select the data source and click the “Tables” tab to choose the table you want to use.

In this example, we will use the Sample Database provided by Metabase to try out and practice using Metabase.

Once the database is selected, the available tables within that database will appear on the right side. Select the Orders table to view the sales data.
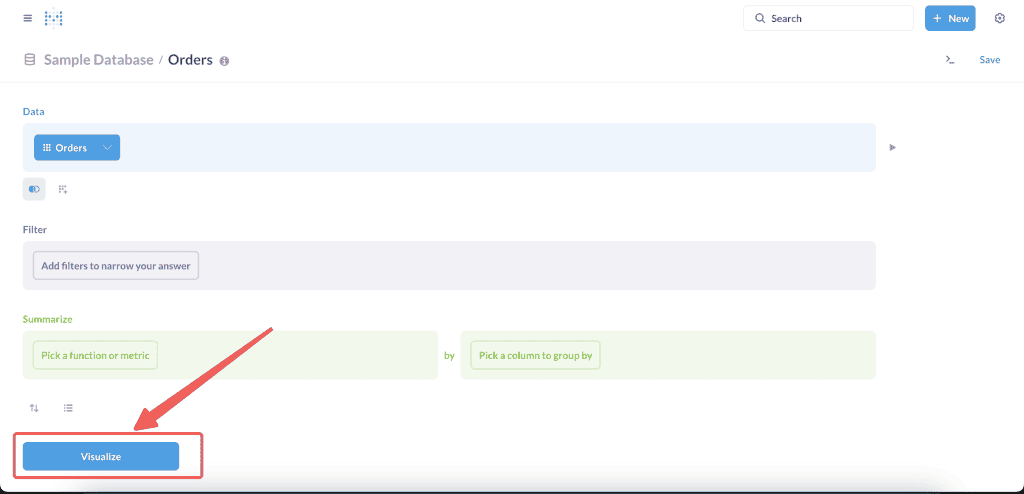
To display the data, click Visualize at the very bottom. The data will be displayed in a Table format, showing the information in rows and columns.
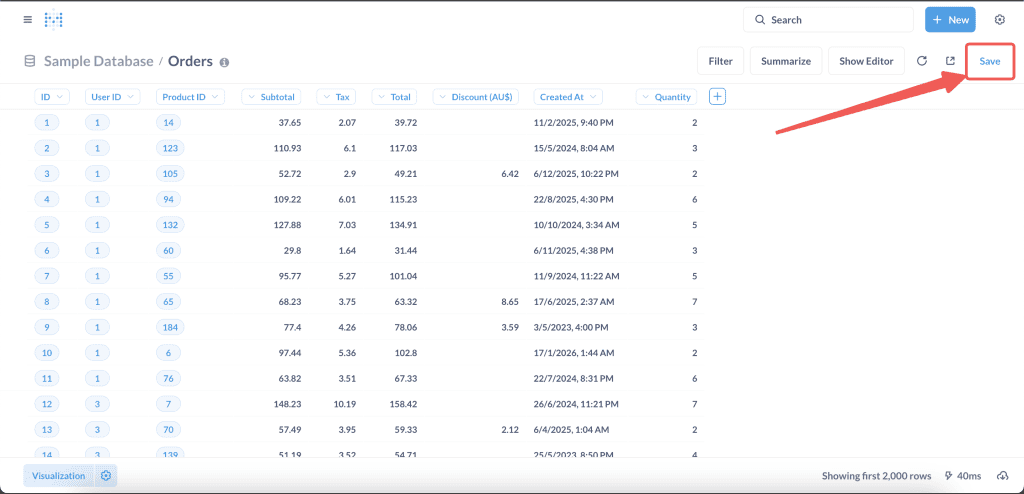
If you want to save it for future use, click Save in the top right corner. Enter a name and choose the appropriate Collection. Your very first Question is now complete, quick and easy!
Join Table
Not all information is stored within a single table, so we often need to retrieve data from multiple tables. For example, in the Orders table we used for our first Question, we cannot see exactly which items were purchased because they are stored only as a Product ID. Other product attributes are stored in their own table, the Products table, so we need to fetch data from that table as well. To do this, we need to perform a table join.
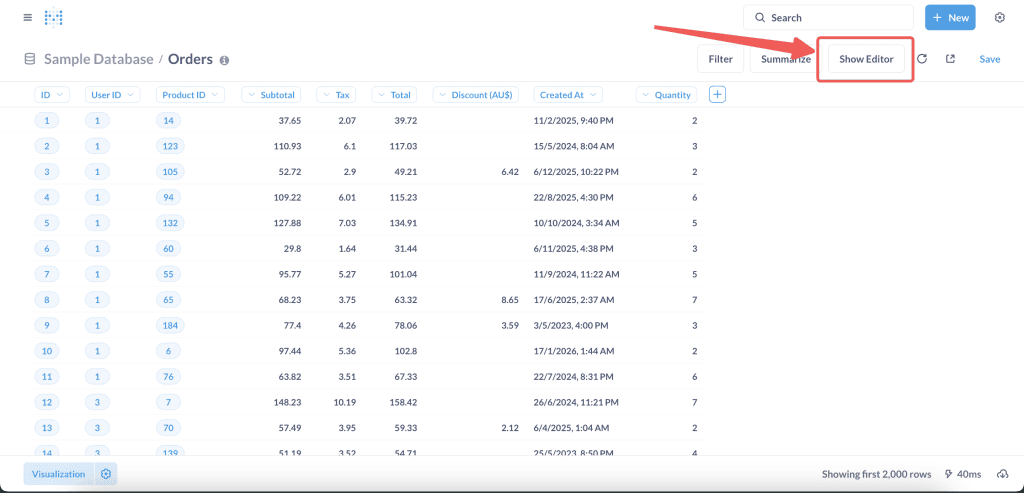
From the same Question view as before, click Show Editor to return to the table selection menu.

Inside the editor menu, click Join data, and a screen will appear allowing you to select another table.

Select the Products table. On the right side, you will see column options to merge the data from both tables. Since this relationship has already been defined at the database level, the columns will be automatically selected in this example: Product ID in the Orders table and the ID column in the Products table. Click Visualize to display the data again. This time, the displayed data comes not only from the Orders table but also from the Products table. The Products table contains many columns of its own; what if we only want to display the product name column? Return to the Editor / Query Builder by clicking the Show Editor button again, just like before.

Click the drop-down arrow next to the Products table name, and a checklist of the currently displayed columns will appear. Check Select None to deselect everything, and then check the Title column to display only the product names. Click Visualize again, and now only the product names from the Products table will appear. However, the Title column is still on the far right—what if we want to place it right next to the Product ID column?

Simply click and hold the Products > Title column header, drag it next to Product ID, and then release it. Once done, click Save again, and you have successfully created a Question by pulling data from two tables.
Filter Data (Filter)
So far, the Question we created still displays all the data contained within a single table. What if we want to filter the data we display? Using the same example, we will try to display sales data from last month that also offered a discount to customers.
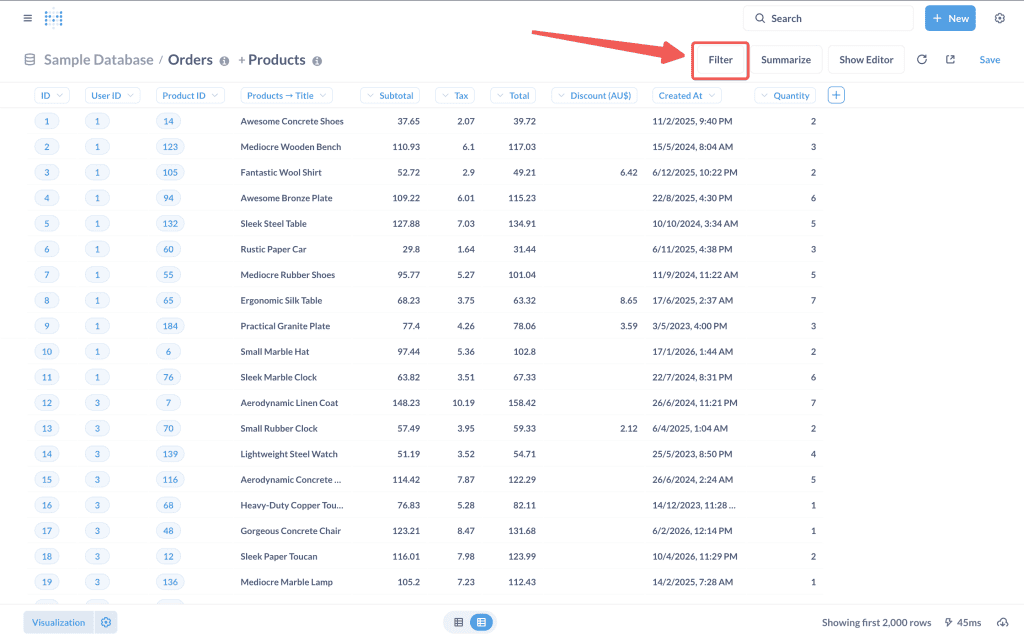
So far, the Question we created still displays all the data contained within a single table. What if we want to filter the data we display? Using the same example, we will try to display sales data from last month that also offered a discount to customers.

Returning to the Filter, select the Created At column and click Last month. With this filter applied, the displayed data will only include records where the Created At date falls within the previous month. For instance, if the current month is September, the data shown will be from August. After that, we will proceed to add another filter to find sales that include a Discount.
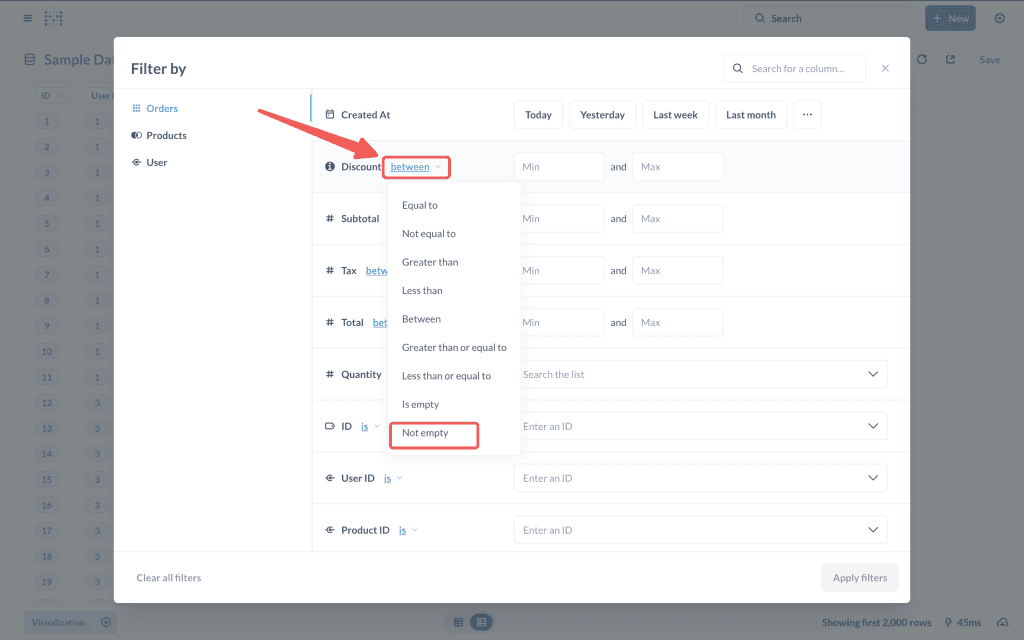
Next to the Discount column, you will see the word between underlined in blue. Click on it to open a dropdown menu with several filter options. Since we only want to find records that have a discount, select Not empty to display data where the Discount column is not blank. Click Apply filters in the bottom-left corner to update the data based on your filter.
Data Aggregation (Summarize)
An essential part of data analysis is viewing data in various formats. We are often used to looking at data solely in tables that display every single column. While detailed data is absolutely necessary, granular information can sometimes overwhelm users, making it difficult to extract meaningful insights.
For instance, you might want to know: Which of our products is the best-seller this month? or On which days do sales transactions peak? We cannot easily uncover these trends just by looking at a standard table of rows and columns.
This is where data aggregation comes in—it allows us to gain insights by viewing the data from a different perspective. Taking our previous example, what if you want to find out which product generated the highest sales revenue? To do this, we need to sum up the sales values from the Orders table and group them by product name.
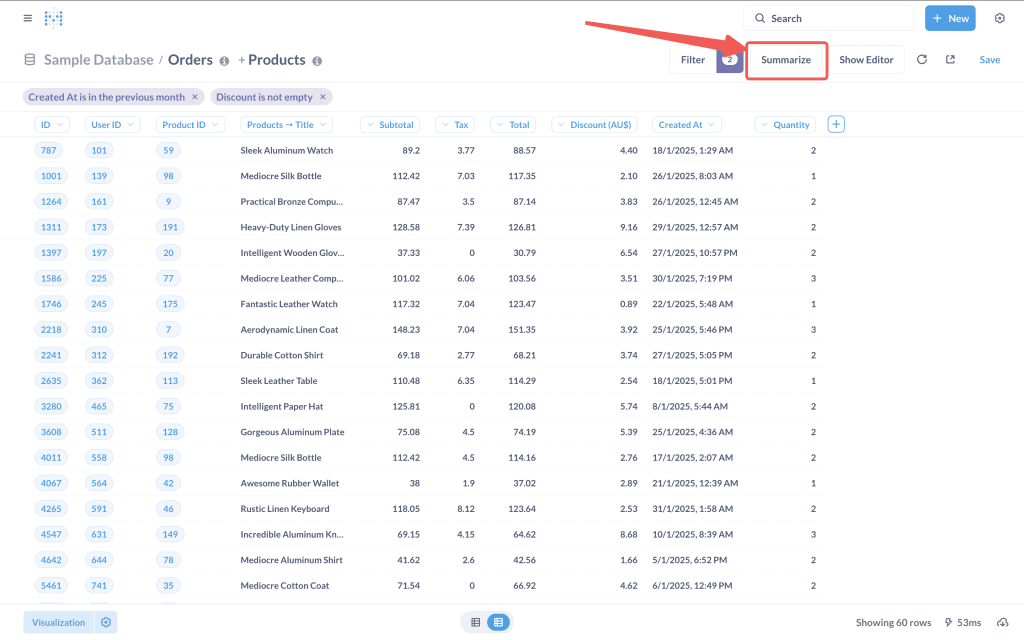
To do this, click Summarize in the top-right corner.
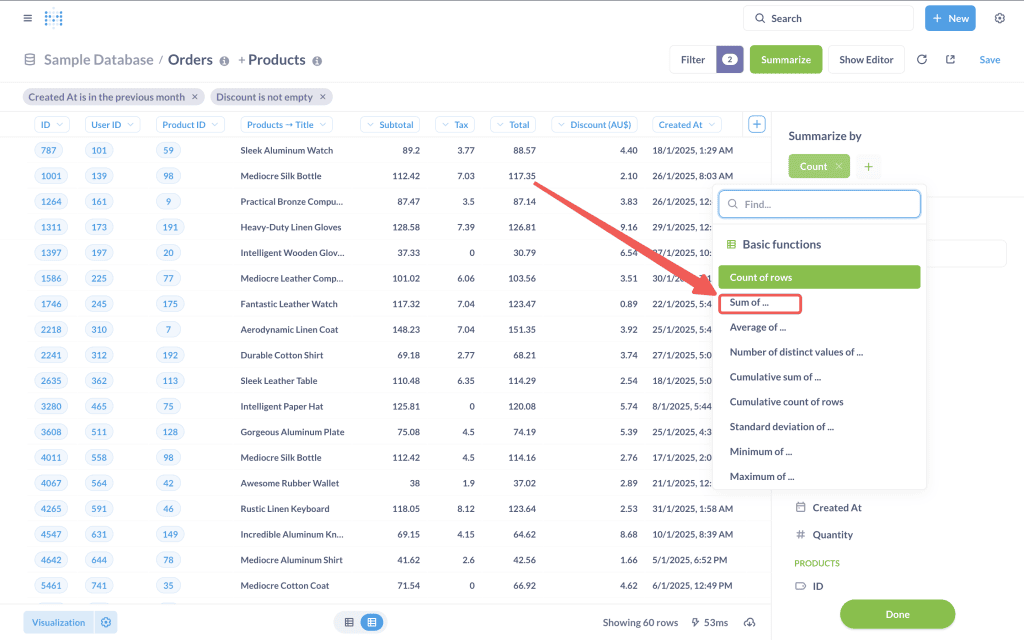
Since we want to calculate the total, we need to change the Summarize method from Count to Sum of. Click on the green button that says Count, change it to Sum of, and then select the column you want to aggregate.

Since the column we want to aggregate is the sales value, we select the Total column. The data display will now change to show only a single total figure, which represents the total sales value of all existing data. Because we want to view the sales per item, we need to perform one more step: selecting Group by.
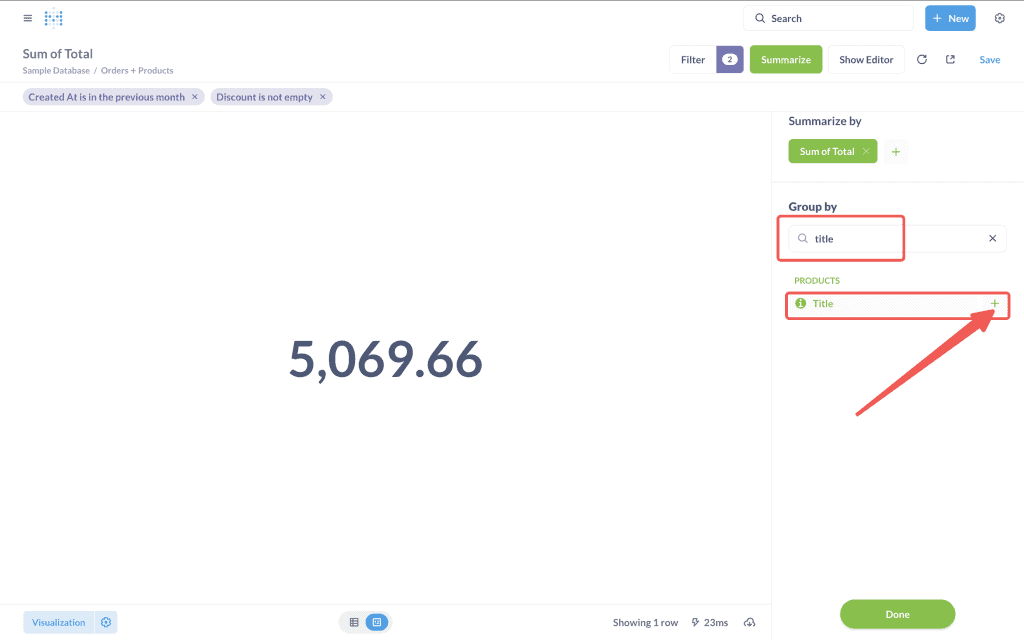
The Group by option is located right below the Sum of setting we just configured; from there, select the Title column from the Product table.
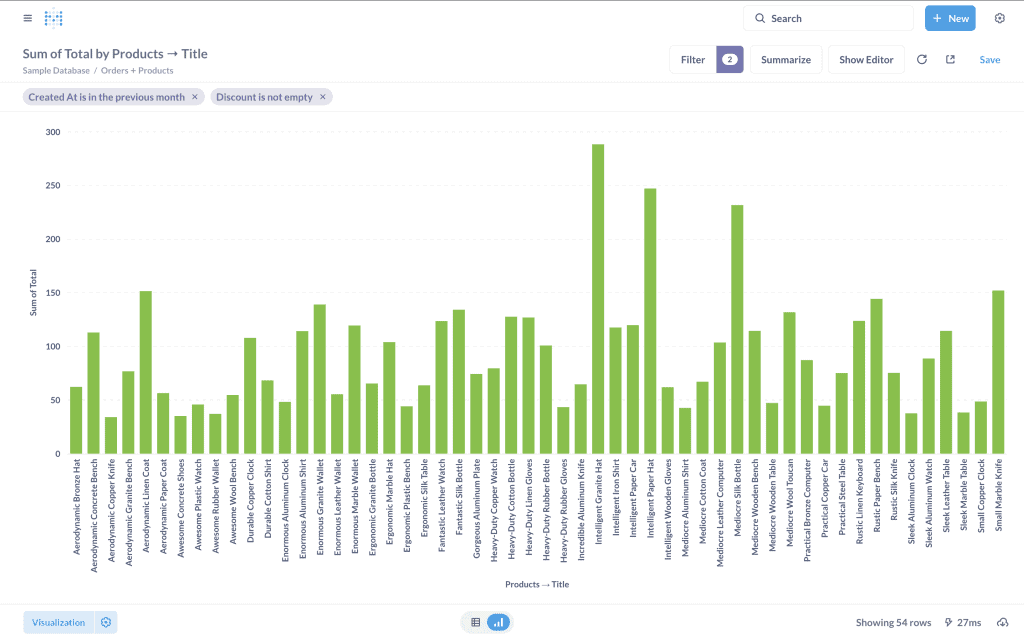
The data display should now change into a Bar Chart that shows the total sales value per item. From this graph, we can immediately see which products have higher sales simply by looking at the tallest bars—which is obviously much easier than staring at a cluster of numbers in a table. This is the main advantage of visualizing data with charts: you can instantly gain insights just by spotting patterns in the graph. While our chart already provides highly valuable information at a glance, we can make it even easier to understand and configure it to display insights like the Top 10 best-selling items.

To do this, return to the editor and click Sort (the gray text next to the Join Data button), then select Sum of Total. A gray button labeled Sum of Total with an up arrow will then appear; click the arrow icon to flip it downward. This will arrange your data display to show the total sales value in descending order, from largest to smallest.

Finally, to display only the top 10 items, click Row limit. A new field will appear prompting you to Enter a limit—type in 10, and then click Visualize. Your chart will now display the Top 10 items with the highest sales value, ordered from the highest on the far left to the lowest on the far right.
Creating Your First Dashboard in Metabase
What is a Dashboard in Metabase?
A dashboard is one of the most powerful features in Metabase, serving as a central hub where your data insights are unified into a cohesive visual presentation. Unlike individual questions that focus on a specific data point, a dashboard is a collection of visualizations, metrics, and text elements arranged on a single screen to tell the complete story of your data.
Why Do You Need to Create a Dashboard?
In Metabase, while a Question provides you with a single piece of critical information, a dashboard gathers all these Questions in one place so they are easier to understand and can complement one another.
Much like separate puzzle pieces compared to the completed picture, a Question only gives you a small part of the story, whereas a dashboard displays the entire picture. This holistic view enables decision makers to:
- Share a consistent data perspective across teams and departments.
- Identify correlations between different metrics that might not be obvious when viewed in isolation.
- Monitor multiple KPIs simultaneously without switching between screens.
- Understand how different aspects of the business influence one another.
- Track performance changes over time through regularly updated visualizations.
Take a look at the example dashboard we have already created to better understand how to use dashboards in Metabase.
Creating a Dashboard
Adding Questions to a Dashboard
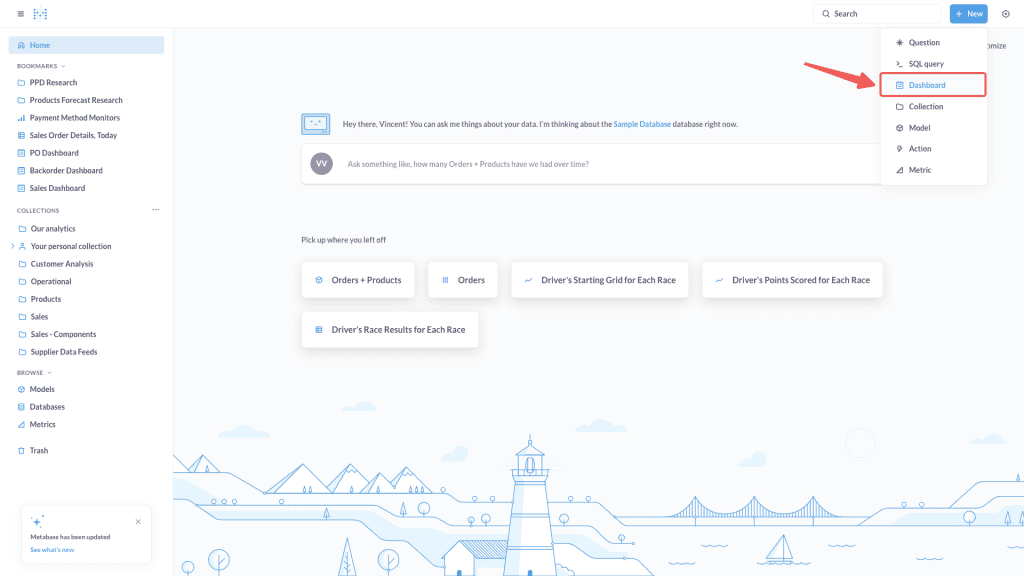
To create a dashboard, click the New button on the menu page > select Dashboard. Enter a name for the dashboard and choose the Collection where it will be saved
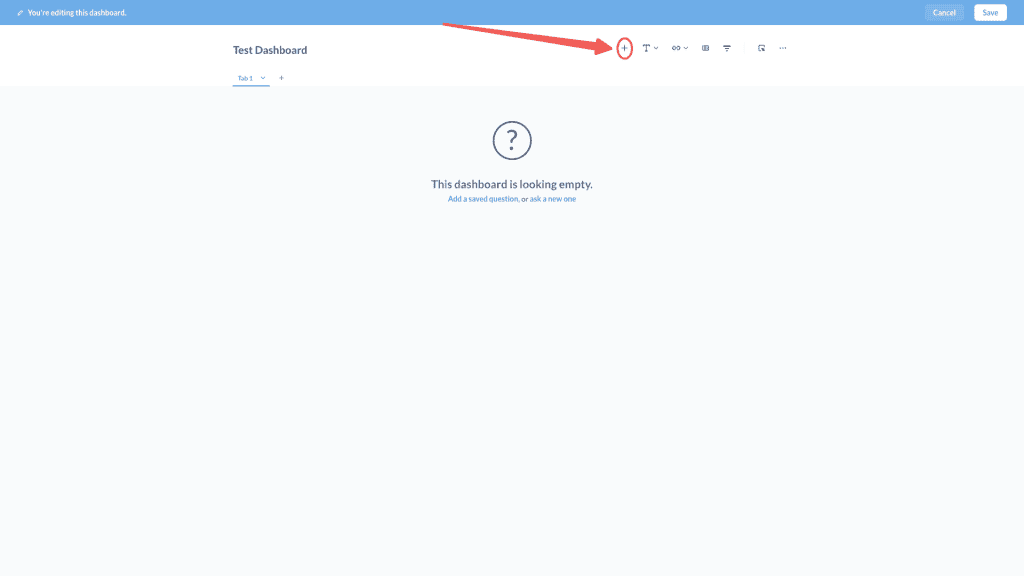
In the dashboard view, there is an option to add Questions or charts to be displayed on the dashboard. Click the Add Questions button to display the Question list on the right.
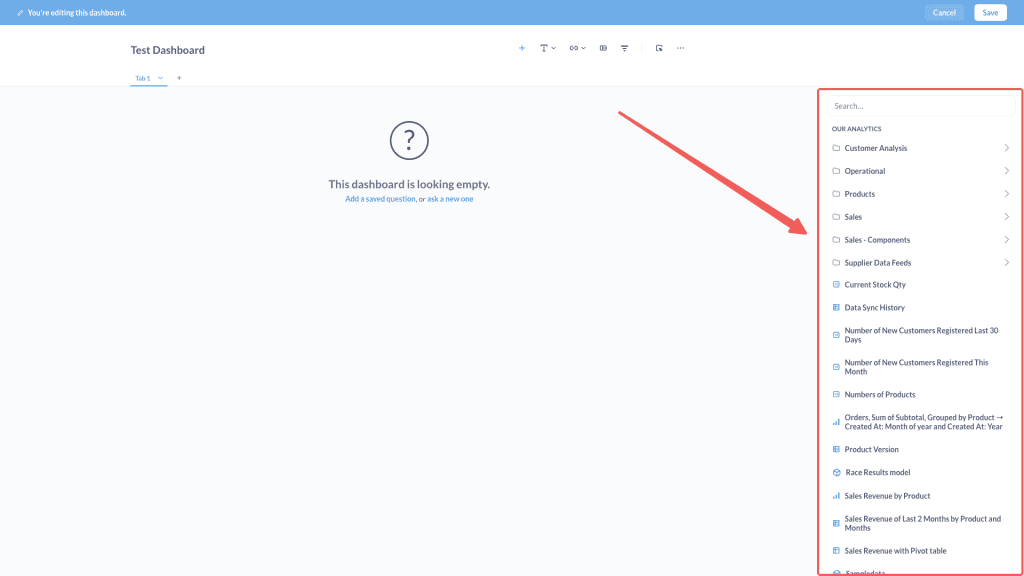
Click on the Question you want to add to the dashboard

Displayed Questions can be resized by hovering your mouse over the bottom-right corner of the Question and dragging it to enlarge. You can also reposition Questions within the dashboard layout by dragging them to a new location. Once you are finished adding Questions, save the dashboard by clicking Save.
Add Filters to a Metabase Dashboard
Questions within a dashboard can be filtered according to our chosen parameters. We can also specify which Questions will change in response to the selected filter. Additionally, filters can be configured with a default value so that when the dashboard is opened, it immediately displays data with that filter applied.

To add a filter, click the Edit Dashboard button, then click the Add filter / parameter button in the top right corner. There are several filter options available depending on the data type you want to filter. In this example, we will filter by date, so we will select the date picker. After that, a parameter field will appear at the top, and you will be asked to map that parameter to the corresponding column in each Question. Select the desired column and click Save. The filter has been successfully created and is ready to use.

When selecting a value in the filter, the charts we have mapped will update their content according to the chosen filter
Adding Custom Click Behavior
Custom click behavior allows you to define what happens when a user clicks on specific data within a dashboard chart. By default, when a user clicks on a visualization element, such as a bar in a graph or a row in a table. Metabase displays the detailed data for that item. However, by configuring Custom Click Behavior, you can redirect that interaction to be more meaningful and aligned with your intended analysis workflow.
Custom Click Behavior empowers users to delve deeper into the data, apply relevant filters, or even navigate to another, more specific dashboard. This feature is highly valuable for creating dashboards that are not only informative but also interactive, enabling users to explore data independently without needing assistance from the data team.
Types of Custom Click Behavior
Metabase provides several types of Custom Click Behavior that you can apply to your dashboard visualizations. Each type serves a different function and purpose, depending on what you want to achieve.
1. Drill Through Menu
The drill through menu is Metabase’s default behavior when a user clicks on a visualization element. Typically, this displays the details of the clicked data or value in a pop-up window, also known as a drill-down. Although simple, this behavior remains useful for viewing specific values without changing the overall dashboard display.

To perform a drill-down, click on a chart within the dashboard, and several drill-down options will appear. The first option is ‘See these…’. Use this option if you frequently need to check the underlying data. This option will display the detailed data in a table format based on the category clicked in the chart. In the example image above, clicking on the Samsung brand within the bar chart will display data specifically for the Samsung brand.

The second drill-down option is ‘Break out by.’ Breaking out allows you to group data by a new category or a specific date and time. To do this, click on a category within the chart, select ‘Break out by,’ and choose either ‘Category’ or ‘Time.’ In the example above, we click on the Samsung brand and break it down by Product Category. This means we are exploring the Product Categories of items registered under the Samsung brand

The third option is X-ray. This built-in Metabase feature displays a variety of statistics for the selected metric to help you check for any anomalies in your data. In this example, X-ray displays the top 5 highest and bottom 5 lowest sales values. At the very bottom, it also shows the distribution of sales values across each transaction. The results generated by X-ray can be saved as a dashboard by clicking ‘Save this’ at the top

The final option is simple yet highly useful: ‘Filter by value’. Click on the category you want to filter and choose the target amount, whether you want to see values greater than or less than the selected amount. This option can be used for various scenarios. For example, if a bar chart displays the top 10 brand sales, you can click on the very last brand and filter by a smaller value to see which brands rank below the top 10 and so on.
2. Update a Dashboard Filter
This option allows the value clicked by a user to automatically filter the entire dashboard. For instance, if you have a sales chart by region and the user clicks ‘Jakarta’, all other visualizations on that dashboard will be filtered to display only Jakarta data. This is highly effective for creating dashboards that are responsive to the user’s focus on a specific data segment.

To add it, click ‘Edit dashboard’ and then hover your mouse cursor over the chart you want to modify. A box with various icons will appear; click the second icon from the left to add a custom click behavior. Once clicked, a panel will appear on the right side showing three options. Click the bottom option, ‘Update a dashboard filter’, which will display the existing filters on the dashboard. Click the filter you want to update and select the column to be mapped to it. In the example above, we select the ‘Product Category’ filter and then choose the ‘Product Category’ column from the chart for mapping. Once completed, click ‘Done’ and then ‘Save’. Now, clicking on the ‘Gizmo’ category within the chart will filter the entire dashboard content to show only data related to the Gizmo category.
3. Go to Question
With this option, clicking an element on a visualization will redirect the user to another specified Metabase question. You can also pass the clicked value as a parameter to that target question. For example, if a user clicks on the ‘Electronics’ product category in a chart, they can be redirected to a question that displays a complete list of all electronic products.

To create a link to a Question, click ‘Edit dashboard’ and change the click behavior on the chart. Select ‘Go to a custom destination’ and choose ‘Question’. In the pop-up box that appears, you can search for the target Question for the link. After selecting the Question, you can determine whether to pass the clicked data as a filter to that Question. For example, if we click on the product ‘Awesome Silk Car’ in the table, the target chart will also be filtered to display only data for ‘Awesome Silk Car’.
Example: When viewing a high-level Sales Dashboard, we might also want to see the specifications of the product we are looking at. There are two ways to achieve this: place a chart containing product specifications on the same dashboard, or use click behavior to link one of the charts to a chart containing those specifications. When should we use the click behavior method? Use it when a single dashboard already displays too many questions, or when the dashboard creator wants users to focus more on the viewed data by taking them directly to that specific chart.
4. Go to Dashboard
This option allows users to navigate to another dashboard when they click a specific element. Just like ‘Go to Question’, you can also pass the clicked value as a filter to the destination dashboard. This is highly useful for creating a dashboard hierarchy, where users can start from a high-level overview and then drill down into a more specific, detailed dashboard

The process of creating a link to a Dashboard is the same as linking to a Question. We determine the destination Dashboard and specify the data to be passed as a filter to the target dashboard. This click behavior is useful when there are multiple dashboards catering to different user needs and to maintain access separation. It is particularly helpful for users who typically view high-level dashboards but also need the ability to drill down into more detailed data.
Metabase Dashboard Subscriptions
Creating a Dashboard Subscription
Dashboard subscriptions in Metabase are an effective solution for keeping your team informed through automated data delivery. Compared to the conventional method of requiring the team to log in and check dashboards manually, the subscriptions feature sends key metrics directly to their email or chat on a set schedule. This automated system ensures that stakeholders always have access to the latest data, thereby fostering a data-driven culture within your organization.
Setting Up Your First Dashboard Subscription
Creating a subscription for your Metabase dashboard is very simple. Once you have developed and refined a dashboard displaying the insights you want to share, open that dashboard. In the top right corner, locate and click the share icon (which looks like a paper airplane). From the dropdown menu that appears, select ‘Dashboard subscriptions’ to begin the setup process.
The subscriptions modal will open, revealing several configuration options. First, you need to determine the delivery method. Metabase supports delivery via email as well as integration with popular team communication platforms like Slack. Email remains the most flexible choice, as it can be used for both internal team members and external stakeholders who might not have access to your organization’s chat application.
Configuring Email Subscriptions
When setting up an email subscription, enter the recipients’ email addresses. You can add multiple emails at once (separated by commas) to send the dashboard to various team members or specific stakeholders. The dashboard will be sent with an email subject that automatically uses your dashboard’s name, so choosing a descriptive dashboard name like ‘Weekly Sales Performance’ will help recipients instantly recognize the email’s content.
For the frequency setting, choose how often the dashboard will be sent. Metabase provides daily, weekly, or monthly schedule options. If you select a weekly or monthly delivery, you can specify the day of the week or the date of the month for the delivery. Setting the right delivery time ensures your dashboard arrives when recipients have the best opportunity to view and utilize the information.
A highly useful feature is the ability to include dashboard filters in your subscriptions. If your dashboard uses filters to slice data, you can configure the subscription to be sent with specific filter values applied. This allows you to create targeted reports for different teams or departments without needing to build separate dashboards.
Another important consideration is the format of the delivered dashboard. By default, Metabase includes dashboard visualizations directly within the email body, making the data instantly visible without requiring recipients to open attachments or click through to the Metabase instance. However, for dashboards with many complex visualizations, you might prefer to send the content as an attachment. To do this, check the ‘Attach results as files’ option and select your desired format. You can also choose which specific charts to attach to the file. Metabase supports CSV and Excel formats; Excel attachments allow recipients to view the underlying data.
Setting Up Slack Integration
For organizations that rely heavily on Slack for internal communication, Metabase’s Slack integration provides a seamless way to send dashboards directly to the appropriate channels. To use this feature, your administrator must first configure the Slack integration at the instance level within the Metabase Admin settings.
Once the integration is established, you can select Slack as the delivery method when creating a dashboard subscription. You will be prompted to choose the specific Slack channel where the dashboard should be sent. Just like with email, deliveries can also be scheduled for daily, weekly, or monthly timeframes.
Exporting / Downloading Charts and Dashboards in Metabase
Metabase provides several ways to export data from questions (queries) and dashboards. This capability allows users to utilize Metabase data outside the platform for further analysis, reporting, or integration with other tools.
Export Data from a Question

You can export data from a Question by clicking the Download button in the bottom right corner. Metabase allows you to export in the following formats:
- .csv
- .xlsx
- .json
- .png (if the Question is in a chart format)
You can choose how the downloaded data is presented:
- Formatted: The data will be downloaded with the exact formatting applied within Metabase.
- Unformatted: The data is downloaded without the formatting applied to the chart’s columns. For example: If a numeric column contains a value like 0.3 and is formatted to display as a percentage (30%), downloading it as unformatted will display the raw number 0.3.
Exporting Data from a Dashboard
You can export data from a dashboard in the following ways:

- Export the entire dashboard as a PDF
To export a dashboard as a PDF, click the ‘Sharing’ button and then click ‘Export as PDF’. The generated PDF file will be split into multiple pages if the dashboard size exceeds a single page.

- Export a specific chart on the dashboard
export a specific chart located within the dashboard, hover your cursor over the chart, click the three-dot icon in the top right corner of the chart, and click ‘Download results’. The available file formats are the same as when exporting a chart from a Question. - Export the dashboard and its data periodically via subscriptions.
To export data through a subscription, you can create a dashboard subscription by navigating to ‘Sharing’ > ‘Subscriptions’.
Want to Try Metabase?
Our team is highly experienced in implementing dashboards across various industries, including crafting the right visualizations for your company. Beyond creating visualizations, we also help ensure your company has accurate, reliable, and rapidly synchronized data by building robust Data Warehouses and ETL pipelines. Try Metabase by consulting with us today